Thermal Station 3.2 LAB
Thermal Systems in Health Fields
IT’S TIME FOR SOME FUN WITH SCIENCE
PRESENTATION AND PRACTICE
Cool Thermoreceptor Distribution
WORK WITH THE ICE WATER, THERMOMETER, INK PAD, STAMP, METAL PROBES, CALCULATOR AND ANSWER SHEET PROVIDED
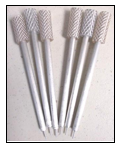
1. Place the thermometer in the ice water, and make sure it is between 40 and 50° F before you start. Place three of the aluminum temperature probes (pointy end down) in the ice water for a few minutes and allow them to cool. |
 |
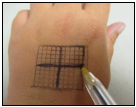
2. You will have to work with a partner for this activity. You can work with another student if available, or you may ask the coach to help you. One of you will have to be the “test subject,” and the other will be the “experimenter.” Use the stamp and ink pad to stamp a grid on the back of the test subject’s hand. |
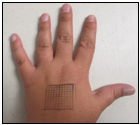 |
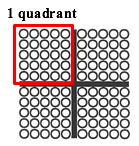
Each grid has 100 dots that are split into four smaller squares called quadrants. To save time, you will only be using the dots in one quadrant (25 dots total). Pick which one you will use (for example, top left) and continue to use that same quadrant for all of the experiments. |
 |
4. Have the test subject place the stamped hand flat on the table with palm facing down, and sit with their eyes closed. When the probes have cooled, remove one from the water and wipe it dry with a paper towel.
5. The experimenter should start at one corner of the chosen quadrant in the grid. (It may help to use a pen to divide the stamped grid into four quadrants to match the answer sheet). Touch the small end of the probe to a single tiny square in the chosen quadrant. Only keep the probe on the square for about two seconds. The test subject should then say out loud either “pressure” or “cold,” depending on which sensation they feel. |
 |
*Note: If the subject is not sure, count the sensation as pressure. A sensation of cold should be very obvious right away.
6. If the subject reports that they feel cold at that location, color in that same grid dot on the answer sheet. If the subject reports that they only feel pressure at that location, leave that dot blank on the answer sheet.
| 7. Repeat these steps with all the dots in the same row as your first, filling in any dots where the subject has a sensation of cold. | 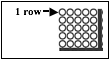 |
8. When you finish all 5 dots in that row, place your current probe back in the ice water and get a new one to complete the next row. This will ensure that the probe being used is always cold.
9. Continue to test all of the dots in the chosen quadrant (5 rows total), making sure to record all dots where the subject feels cold, and using a fresh probe for every row.
10.Once you’ve finished, count the total number of dots where a cold sensation was felt by the subject. On your answer sheet there is a table for your data. Record the number you counted in the row labeled “# of Cold Spots” under the “Back of Hand” column.
11. Now you will calculate the receptor density in the area you tested. One quadrant has an area of about 1.5 mm2, but we want to know the number of receptors in 1 mm2. To do this, take the number of cold spots you counted and divide it by 1.5 using a calculator. This gives you the number of receptors/mm2. Record your calculation (rounded to 2 decimal places) in the row labeled “Density” on your answer sheet.
12. Now repeat steps 5 through 11 using a new grid stamped on the palm of the same hand. Remember to have the subject close their eyes!
13. Finally, repeat steps 5 through 11 one more time using a new grid stamped on the back of the forearm.
Warm Thermoreceptor Distribution
WORK WITH THE WARM WATER, THERMOMETER, INK PAD, STAMP, METAL PROBES, CALCULATOR AND ANSWER SHEET PROVIDED
- Place the thermometer in the warm water, and make sure it is between 120 and 130° F before you start. Place three of the aluminum temperature probes in the water for a few minutes and allow them to heat up.
- Work with the same partner, use the same test subject, test the same locations, AND use the same quadrant for each grid. This will allow you to accurately compare the concentration of warm and cool receptor sites later. Again, start with the back of the subject’s hand and perform the steps 5 through 11 from the first experiment. The only difference will be that the test subject will say either “pressure” or “warm” depending on what they feel at each spot.
*Note: It is especially important to change probes for at least every row in this part, because the probes tend to cool off quickly.
- Once you’ve gathered and recorded all of the data for the back of the hand, repeat steps 5 through 11 again this time on the palm of the hand.
- Finally, repeat steps 5 through 11 one more time using the back of the forearm.
Application Questions – Write down your answers on your ANSWER SHEET
- Which location had the highest concentration of cold receptor sites? Which had the most warm receptor sites? Why do you think this is?
- Overall (at all three locations), did you find more warm or cold receptor sites? Try to provide a possible explanation for why there would more of one type than the other.
- Can you think of another place that we didn’t test that might have an even greater concentration of thermoreceptors (meaning it would be even more sensitive)?
Evaluation
Your lab performance will be evaluated by the criteria (standards) you will find in this project’s rubric. A rubric is simply a table that states how you will be evaluated. Your coach will use this table to report your performance.
CLICK HERE to go to the RUBRIC
LAB REVIEW
- The hypothalamus is always working to keep the body’s temperature around 98.6° F, called the set point.
- The somatosensory system is responsible for monitoring body temperature and sending this information to the hypothalamus.
- The somatosensory system also gathers information about pain, tickle, itch, sensation of movement, body position, and all of the cutaneous sensations.
- The cutaneous senses include touch, pressure, vibration and temperature.
- All cutaneous sensations are triggered by stimulating receptors in the skin, which pass the signal to the brain through afferent (sensory) nerves.
- Receptors that respond specifically to changes in temperature are called thermoreceptors.
- Each receptor is only capable of responding to either warm or cold within specific temperature ranges.
- Any temperature felt that is outside the ranges of the thermoreceptors activates special pain receptors called thermal nociceptors instead.
- Both types of receptors may be activated when the skin is at its normal temperature, but we do not usually get a sensation of cold or warm. This is called the neutral thermal region.
- Each thermoreceptor has a specific area of the skin where it is able to detect a stimulus, called the receptive field.
- Different areas of the body also tend to have different receptor densities, which is the number of each type of receptor in a certain area. This means that certain places are more sensitive to temperature changes than others.
- Once the hypothalamus has been alerted that a significant change in temperature has occurred, it activates the thermoregulatory mechanisms discussed in station lab 3.1.
- All thermoregulatory mechanisms are controlled through negative feedback loops.
- A negative feedback loop has four parts: the stimulus, the sensor, the control center, and the effectors.
__________________________________________
![]()
Links to Station 3.2 Modules
Lab Intro | Lab Presentation and Practice | Communications Intro| Communications Presentation and Practice| Math